Thursday, November 23, 2006
Summary of Various Returns and Time Periods on S&P 500 (Click here)
Spreadsheet summary of various returns and time periods on S&P 500 since 1960. (Click on Title)
S&P 500 Gains over 17 Weeks (Click Here)
A spreadsheet of the S&P 500 data from 1960 showing > 230 occurences of a 12.9% or greater gain in 17 weeks. Click on title to bring up spreadsheet.
IA Analysis Goofs: Assuming Normality, or Overspecification of the Event?
The enourmous goof, cited in the last post, by IA researchers is astonishing. How could such mistakes occur -- in the face of real data. (claiming a 3/10,000 chance for normal occurance of recent market increases since the start of IA -- when such an event -- a 13% run-up in 17 weeks -- has occurred over 220 times since 1960.
One possibility for the goof is a well-known issue that can be made in studies of financial markets is to using analysis and models that assume a normal distribution. Distributions of the returns for most financial markets, certainly the S&P 500 -- the proxy for all US markets -- has "fat tails" and a lower peak than a normal distribution. More like the top half of a somewhat flattened circle -- aka an elipse, than the classic "bell" shape of a normal (aka guassian) distribution.
For some analysis, in the main body of the distriubtion, the difference is not to substantial. However, when analyzing the tails, the extreme events, the normal distribution extremely underestimates the occurence of extreme gains or losses, that is the top or bottom 1% or more accutely, the top .1% of the distribution.
Such laxness in using normal distribution assumptiosn when modeling financial markets is one reason for the famous, dramatic collapse of the hedge fund LTC -- Long Term Capital -- built and managed by some of the best academic minds on Wall St. They simply underestimated the probability of "the perfect storm". Instead of being a one in 500 or so year event, it occurs far more "frequently" -- and did so on their watch, collapsing 100 billion dollar portfolios to nothing within weeks.
As an example of this, looking at just 13 years of S&P 500 data, assuming a normal distribution -- as is the case when applying most tests of significance in statistics, the top return day, is overestimated in its rarity, by a factor of 15,000. The third top day by a factor of 5000. The top 10th day by a factor of 250. The rarity of the top 80 days are overstated by assuming the S&P 500 is normally distributed, though the factor of overstatement declines rapidly from the top down to the 80th highest daily return. The same occurs on the left tail, the lowest, or most negative returns. And in the middle of the distribution, the "rarity" of returns is underestimated.
In the IA analyusis, the same principle applies: Assuming normal distribution, as most statistical and econometric software does, will underestimate the frequency of extreme events -- certainly the top 1 or 2, or 10 or so. In other words, it will deem such a tail event much rarer than it really is, Thus, the 3/10,000 probability couldbe overestimated by a factor of 100 or 1000.
A second possibility of where the IA analysis flaw lies is overspecification of the event. For example, instead of testing for 13% rises in the S&P 500 over 17 weeks, one could have tested 13% rises in the S&P 500 over 17 weeks where there is a pattern that there are weekly declines in the 3rd, 5th and 7th weeks of the series. That is the pattern of the recent rise, but is absolutely unimportant to the premise being tested: if the 13% rises in the S&P 500 over 17 weeks is "rare" or if it naturally occurs periodically. The occurence of 13% rises in the S&P 500 over 17 weeks with weekly declines in the 3rd, 5th and 7th weeks of the series is indeed much rarer than the over 220 times the simpler 13% rises in the S&P 500 over 17 weeks has occurred since 1960.
Perhaps the overspecified event happened only this time, First time ever. So it would about 1/2500 (52 weeks * 47 years) or so probability, which is in the range of the IA's 3/10,000, 1/3333 or .033% stated probability. But of course such a hypothetical overspecified analysis is quite flawed since the pattern of weekly declines in the 3rd, 5th and 7th weeks is totally inconsequential to the event of interest: a 13% rise in 17 weeks. The event, not overqualified or orverspecified in inessential ways, has occurred over 220 times in under 2500 weeks -- about 10%. Far from .033%.
Thus, the caveat to always eye-ball the underlying data and results. Does looking at the recent rise in the context of looking at the last 10 or best yet, 40 years of S&P 500 data seem quite unique? No, similar run-ups occured quite periodically.
A 13% Gain over 17 weeks in NOT a Rare Event
A recent IA experiment press release states the "advanced econometric models" show a 3/10,000 chance for normal occurance of recent market increases since the start of IA. Thus the so-called rarity of the event opens the door for claims of some special new effect.
Lets actually look at the data.
The current IA experiment has run 17 full weeks, and the S&P 500 has risen 12.9% in that period. Good show.
But what is the naturally occurring frequency of a 12.9% or better gain in any 17 weeks period. Going back to 1960, it has occurred on average 4.98 times / year. That is, for any given start week, there is a about a 10% (4.98/52) chance, historically over almost 50 years, that there will be a 12.9% or better gain in the S&P500.
And if you allow 20 weeks to realize the same 12.9% gains, that is, same returns, albeit gained slightly more slowly, it has occured on average 7.1 times per year. About a 15% probability that any week will be the start of a 12.9+ gain over the next 20 weeks.
And there is a 20% probability that you will get a 10% or better return on the S&P 500 within 20 weeks.
For the IA experiement claim the current rise in the financial markets since July 21, 2006, the start of the IA experiment, is a very rare event, of the magnitude of 3/10,000 probability is preposterous, and indicative of very naive or slanted research.
12 times there has been double or greater that approximate 13% gain, that is greater or equal to 26% gain in 17 weeks periods -- going back to 1960. It has occurred on average once every four years.
So if the IA produced that rate of growth, they might begin to be able to claim something fairly unique is occuring. Or best, if the S&P 500 yielded a 35% gain in 17 weeks -- which has never occurred in the period since 1960.
If the IA feels the ME is causing the current stock gains, then they need to explain what was the cause of the other 220 or so such rises in the market since 1960 and why such factors are not involved in this recent run-up.
And address why the ME has not caused gains to exceed all others 17 week run-ups -- that is why it has not pushed the market ahead at a 35% clip in 17 weeks.
Looking ahead, the 1750 YF number is just about to be met. So the ME is just beginning, per "theory". What would be unique market events to judge the ramped up, reved-up ME?
A 45% gain over 26 weeks, nor a 60% gain sustained over 52 weeks has ever been achieved by the S&P 500, looking back to 1960. Those are good benchmarks to keep in mind for IA to achieve if the ME is having an effect on markets. It still doesn't establish causality, but would give reason to pursue detailed statistical studies to investigate causality.
So taking the almost 13% gain in 17 weeks as a base, we just need to see an additional 32% gain in the S&P 500 over 9 weeks (from this past monday), and/or a 47% gain over the next 35 weeks to demonstrate a clearly unique event. Until then, or some market movements approaching such, the IA ME PR pronouncements on financial markets will sound a bit hollow.
Tuesday, November 07, 2006
Unfounded Claims -- Amid Interesting Results
From the current coherence project, Invincible America, PR machine:
"Since the Invincible America Assembly began 94 days ago, the Dow has climbed 1100 points to set an all-time high at 12,116, energy prices have plummeted 28%, and inflation fears have dissipated. At the same time, the White House has abandoned its combative, militaristic approach and has adopted a more effective, diplomatic, consensus-based solution to the conflicts in Lebanon, Iran, and North Korea.
WHY THE WALL STREET BOOM SINCE JULY 23?
New Research Documents Positive Market Impact Generated by 1200 Advanced Meditation Experts* Graphs Highlight Dramatic Rise in the Dow, S&P 500, and the Nasdaq Since the Start of the Invincible America Assembly on July 23, 2006
Wall Street started its record-setting bull drive on July 23—the first day of the publlcly announced Invincible America Assembly at Maharishi University of Management in Fairfield, Iowa—the largest scientific demnstration project ever to monitor the positive effects created by 1200 advanced Transcendental Meditation experts on economic, social, and even climatic trends in the nation.
*The probability of observing such a large increase in the rate of growth purely by chance is less than 3 in 10,000 for the S&P 500, 3 in 10,000 for the Nasdaq, and 7 in 10,000 for the Dow.
back to top
Two points:
1) the claims about S&P500 "advanced econometric model results" etc. simply don't meet the most basic of eyeball tests -- which is an essential part of all econometric analysis.
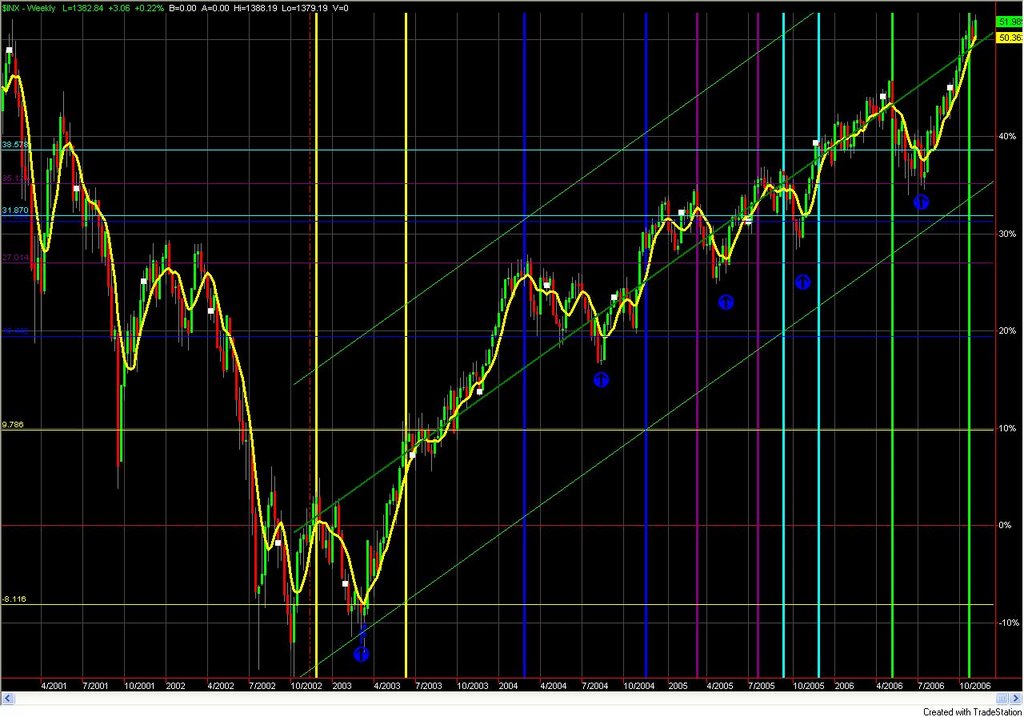
A researcher needs to carefully look at the data -- and all the supporting slices and dices of it that econometric and statistical software provides. Since Oct 2002 when SP500 hit its low after
internet bubble slide, the that been 2-4 upward reversals of the approximate magnitude of the current one. (2 perhaps larger, 2 a bit smaller). The claims of the current reversal being a very rare event -- something like 7/10,000. Thats not at all credible. Simply look at the data -- it happens about once a year.
Current reversal within green bars, other prior reversals within other colored bars.
And note, the current price level is simply a bit above the regression-based trend line. Util it breaks the upper bound (one standard deviation above trend), the current "fluctuation" is within normal bounds and is not a rare event. Its an intersting event and result, worth monitoring. However it is not the phenomenon that MUM researchers claim. Their biases are showing -- and its not dignifed nor attractive.
2) Tweaking sophisticated models allows one to produce analysis results that allow highly qualified (aka limited, "spun" ) statements, with wiggle room, that imply something (the point a researcher wants to make) but do not, in reality demonstrate such. The above four similar reversals in four years is a good example. One can set up and specify the analysis to show the current event to be unlike any other -- but on parameters that are essentially unimportant or meaningless to the point being made.
As a former analysis and researcher in a large corporation using sophisticated statistical, econometric and simulation software, with such analysis having a lot depending on it (being used by top management, and as part of supporting the corporate case in regulatory proceedings and customer proposals), I know from experience that when one has 100 variations or results to provide, it is simply part of (any and all) corporate cultures to provide the best "defensible"
results. One one simply does not provide all results and drone on and on about "on the other hand" -- (which would give a clearer view of the true picture and associated uncertainties and limits of the analysis.) (Partly because the further complex analysis goes up the food chain, the more "cartoon" like it must become.)
My sense from my TMO experience and observations is that the (often quite subtle, and often self-based) pressure to provide such "best defensible" results is even stronger. The analyst behind this "research" (KC) I am sure is getting lots of pats on the head, a few minutes of glory, for his results. And would be looked at with "that look" and displeasure if he produced a comprehensive and unbiased set of conclusions. Or simply looked at the data and said "these rare events findings are clearly anomolies and due to unjustified model tweaks, because 'look' -- anyone eyeballing the raw data can see it does not support these model results."
On the other hand, the IA course does coincide with the exact low point of a major reversal -- something that only occurs about once a year. That is an "interesting", "hmmmm, chin scratching result".
And if the SP500 goes up another 10-15% in the next few months, it will be a "rare event" -- and something to crow about. Or, if SP500 goes into a long sustained 2-5 year aggresive rally -- more likely the results of ME -- IMO -- since reasonable theroy would indicate some lag period between intervention and full effect.
Monday, October 09, 2006
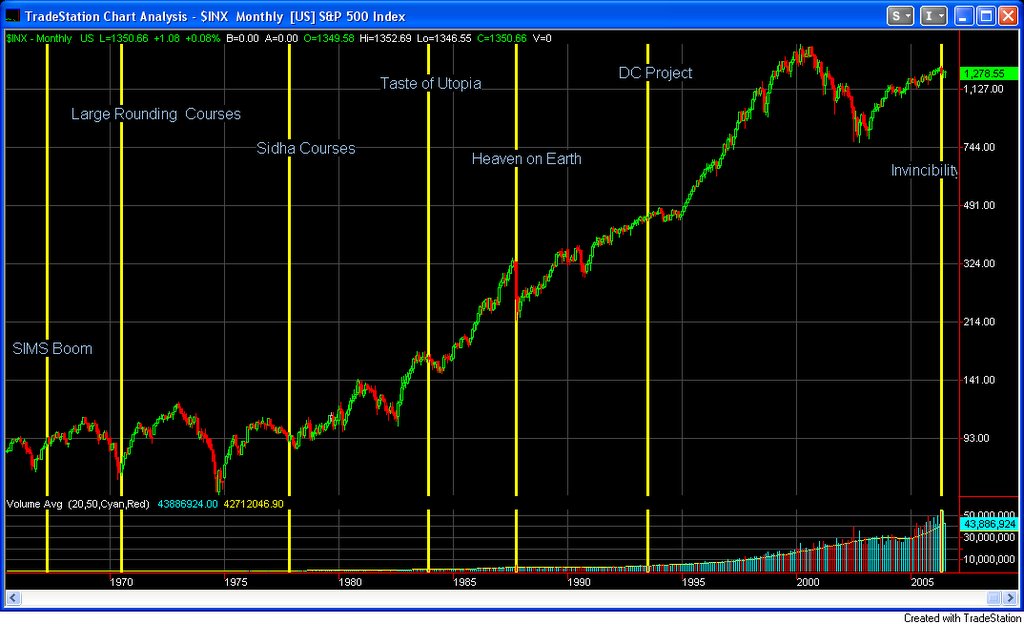
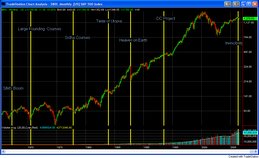
Various TMO Coherence Events on Plot of S&P 500
Plot is in semi-log form so all % changes appear in same scale
Coherence Events:
SIMS Boom starting in mid 1967
Large rounding courses starting in mid 1970 through 1972
Introduction of Yogic Flying to TMers via Sidha courses starting end of 1977
Taste of Utopia Course 1984
Heaven on Earth Course 1987
DC Course
Invincibility Course 2006
Following each event, there was a pronounced market upturn -- often lasting for years.
While this is not proof of any ME effect, it is interesting antecdotal / visual evidence -- creating interest for more detailed statistical studies.
Sunday, July 30, 2006
Theory for Interpreting the ME Impact on Financial Markets
Recent coherence project announcements stress the immediate impact of the project on financial markets. Presumably the theory is that coherence improves collective optimism, and optimism moves markets upwards. Thats true in the short-run, but optimism is not a change in the fundamental core of the economy, in the nuts and bolts, bits and photons if you will, of the economy. Its a perception, a change in interpretation about the fundamental core of the economy. Perception, and the core itself, are two quite distinct things.
As pointed out in a prior post, the substantive effects* of the three prior large ME projects took some time to mature and manifest. The immediate short-run effects indeed were negative.
Three patterns or phases (P1,P2,P3 ) emerge upon examining short-run ME effects on financial markets:
For example, "Companies can increase productivity in a variety of ways. The most obvious methods involve automation and computerization which minimize the tasks that must be performed by employees. Recently, less obvious techniques are being employed that involve ergonomic design and worker comfort. A comfortable employee, the theory maintains, can produce more than a counterpart who struggles through the day. ...
http://en.wikipedia.org/wiki/Productivity_%28economics%29
"Much of the difference in countries’ living standards reflects differences in their productivity...
... they conceded that during the previous five years [1995-2000] the United States enjoyed the fastest productivity growth in any such period since the second world war. Over the whole period from 1995, labour productivity growth averaged almost 3% a year, twice the average rate over the previous two decades."
http://www.economist.com/research/Economics/alphabetic.cfm?TERM=POPULATION
This fastest pace of productivity gains was during the same period of the most rapid rise in the stiock market in history, the internet boom/bubble. (And correlates with the phase III pattern of the DC Coherence project. )
The structural changes in the economy -- and related social (work ethics), cultural (gender equality in the workplace), political (regulation, tax policy) changes that yield higher productivity - and ultimately are what drive financial markets higher -- do no happen over night. A two week coherence project is not going to produce immediate long-range economic, social, cultural, political, or technolgocal changes.
However, consistent with the inital patterns found in the correlation between past coherence projects and financial markets, it is plausible that there is a incubatory or healing lag between a cohernece project and a long-run sharp rise in financial markets.
For example, many factors contributed to the sharp increase in productivity, and the corresponding market explosive rise 1995-2000. Many many independnet factors had to develop to a critical point, and then come together and interact in new ways: fiber optic capacity, miles of fiber optics layed, development of web browsers and related languages -- HTML, Java -- fast, highly scalable servers, faster, cheaper more accessible PCs and GUI operating systems, innovations in and huge inflows of funds to capital to venture capital financing sources, wide-spread use of stock options and other performance compensation, wide accessability of the internet to the public, increasing broadband availability, telephone and cable companies laying fiber-optic backbones to enable broadband services, the fluorishing of innovative business models (Amazon, E-bay, etc) .
The above changes did not happen over night -- or during a 2-6 week coherence project. The DC project, if it had an effect on financial markets, did not immediately transform the economy via such changes. To expect immediate substantial rises in the market resulting from a cohernece course is naive and "magical" thinking.
It is however at least conceptually plausible, that the DC course created a short perieod of intense coherence, and that this coherence -- via yet to be understood "black-box" mechanisms active over the next 18 months, created a strong healing, renovation , rejuvination and/or integrative forces in all the various diverse factors that drove the productivity gains of 1995-2000 --- and subsequently (over)drove the stock market to substantially higher levels.
* if the market changes are actually caused by ME -- yet to be conclusively demonstrated.
Recent coherence project announcements stress the immediate impact of the project on financial markets. Presumably the theory is that coherence improves collective optimism, and optimism moves markets upwards. Thats true in the short-run, but optimism is not a change in the fundamental core of the economy, in the nuts and bolts, bits and photons if you will, of the economy. Its a perception, a change in interpretation about the fundamental core of the economy. Perception, and the core itself, are two quite distinct things.
As pointed out in a prior post, the substantive effects* of the three prior large ME projects took some time to mature and manifest. The immediate short-run effects indeed were negative.
Three patterns or phases (P1,P2,P3 ) emerge upon examining short-run ME effects on financial markets:
- market trends flatten or reverse DURING the project
- 2-14 months after the project market trends are flat or remain within a trading range.
- after this flat period, trends become positive.
- major medical procedure -- the patient experiences a type of shock from the major intervention, sytems flatten or reverse.
- a recouperation phase where the patient rests and heals from a major medical procedure
- a healthy rebound, beyond past levels of vigor, after the patient is fully healed.
For example, "Companies can increase productivity in a variety of ways. The most obvious methods involve automation and computerization which minimize the tasks that must be performed by employees. Recently, less obvious techniques are being employed that involve ergonomic design and worker comfort. A comfortable employee, the theory maintains, can produce more than a counterpart who struggles through the day. ...
Increases in productivity also can influence society more broadly, by improving living standards, and creating income. They are central to the process generating economic growth and capital accumulation.
Many economists see the economic expansion of the later 1990s in the United States as being allowed by the massive increase in worker productivity that occurred during that period. The growth in aggregate supply allowed increases in aggregate demand and decreases in unemployment at the same time that inflation remained stable. Others emphasize drastic changes in patterns of social behaviour resulting from new communication technologies and changed male-female relationships."http://en.wikipedia.org/wiki/Productivity_%28economics%29
"Much of the difference in countries’ living standards reflects differences in their productivity...
... they conceded that during the previous five years [1995-2000] the United States enjoyed the fastest productivity growth in any such period since the second world war. Over the whole period from 1995, labour productivity growth averaged almost 3% a year, twice the average rate over the previous two decades."
http://www.economist.com/research/Economics/alphabetic.cfm?TERM=POPULATION
This fastest pace of productivity gains was during the same period of the most rapid rise in the stiock market in history, the internet boom/bubble. (And correlates with the phase III pattern of the DC Coherence project. )
The structural changes in the economy -- and related social (work ethics), cultural (gender equality in the workplace), political (regulation, tax policy) changes that yield higher productivity - and ultimately are what drive financial markets higher -- do no happen over night. A two week coherence project is not going to produce immediate long-range economic, social, cultural, political, or technolgocal changes.
However, consistent with the inital patterns found in the correlation between past coherence projects and financial markets, it is plausible that there is a incubatory or healing lag between a cohernece project and a long-run sharp rise in financial markets.
For example, many factors contributed to the sharp increase in productivity, and the corresponding market explosive rise 1995-2000. Many many independnet factors had to develop to a critical point, and then come together and interact in new ways: fiber optic capacity, miles of fiber optics layed, development of web browsers and related languages -- HTML, Java -- fast, highly scalable servers, faster, cheaper more accessible PCs and GUI operating systems, innovations in and huge inflows of funds to capital to venture capital financing sources, wide-spread use of stock options and other performance compensation, wide accessability of the internet to the public, increasing broadband availability, telephone and cable companies laying fiber-optic backbones to enable broadband services, the fluorishing of innovative business models (Amazon, E-bay, etc) .
The above changes did not happen over night -- or during a 2-6 week coherence project. The DC project, if it had an effect on financial markets, did not immediately transform the economy via such changes. To expect immediate substantial rises in the market resulting from a cohernece course is naive and "magical" thinking.
It is however at least conceptually plausible, that the DC course created a short perieod of intense coherence, and that this coherence -- via yet to be understood "black-box" mechanisms active over the next 18 months, created a strong healing, renovation , rejuvination and/or integrative forces in all the various diverse factors that drove the productivity gains of 1995-2000 --- and subsequently (over)drove the stock market to substantially higher levels.
* if the market changes are actually caused by ME -- yet to be conclusively demonstrated.
3 Phase Patterns of ME on Markets
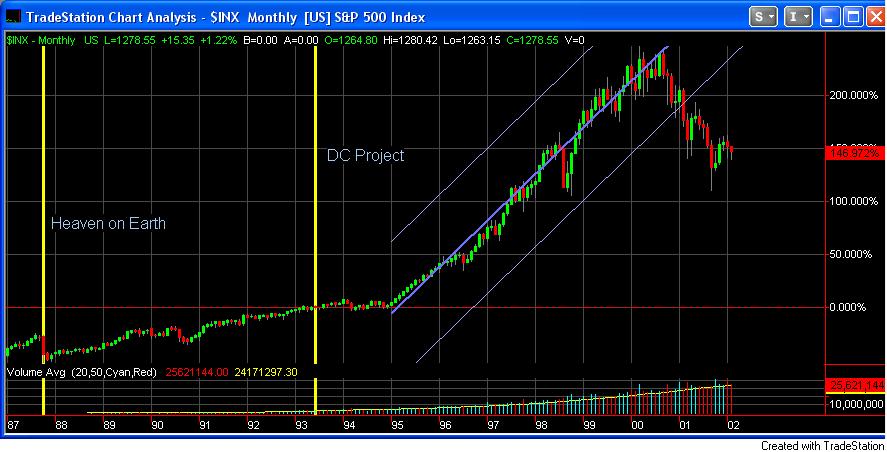
For the three couses, Utopia, Heaven on Earth and DC, the phase III pattern period respectively lasted 3, 6 and 5.5 years -- and is correlates with 100%, 40% and 200% gains in the S&P 500.
The phase III pattern of the prior Heaven on Earth project came to a close with the trend stopping impact of the DC project. Upon resuming a new phase III pattern, the DC project, IF causative**, greatly amplified the upward slope of Heaven on Earth phase III pattern by a factor of 5.
At this point in the analysis, prudence dictates that this be identified as an interesting but probably random correlation of ME project phase III's with rapid market growth.
For example, the DC project phase III pattern period corresponds to the internet bubble period. "How convenient!" any rational observer would say -- laughing it off.
However, ME theory predicts that the ME produces strong coherence in all levels of a society, and should spur innovation and breakthroughs. The internet bubble period was a dramatic breathtaking period of such innovation. The increased speed and connections of people, things, information dramatically transformed how business and personal lives were conducted. Quite serious and respected financial analysts at major firms bought heavily into the notion that we were in a major "breakthrough period", a "New Economy", where old rules no longer applied. While such exuberance was out of proportion to and overshot the reality, and the market finally found its equillibrium after the heady high of the "rush" towards the "New Economy", the innovations and breathroughs of that period were quite real and dramatic. And continue today. Just as ME theory predicts.
Thus, while the ME theory's predictions on financial markets are far from being clearly and repeatedly demonstrated in a statisically significant sense, they certainly have not been disproven -- as indicated by the highly correlated positive market performance following these three ME courses.
More analysis to follow, as data on other ME projects is obtained and mapped to changes in financial makets.
*See precceding post on short-term effects of ME for an explanation of the three phased pattern durning and after ME projects.
** A casual link has yet to be demonstrated. All that can be said currently, at this stage of the analysis, is that ME phase III patterns are strongly correlated with periods of sharp and rapid market growth.
Long Run Impact of Heaven on Earth Project -- Phase 3 Pattern
In the six years of its phase III pattern (see precceding post on short-term effects of ME for an explanation of the three phased pattern durning and after ME projects), the S&P 500 gained 40% in value.
The phase III pattern of the prior Utopia project came to an abrupt halt with the Black Monday crash -- which occurred during the heaven on Earth course.
The phase III pattern of the prior Heaven on Earth project came to close with the trend stopping impact of the DC course.
Summary of Short-Run Stock Market Trends During and After Prior Large Maharishi Effect Projects
With only three projects thus far analyzed, its possible, probable, that the Maharishi Effect has no visible effect on financial markets, and the following are simply spurious / random correlations.
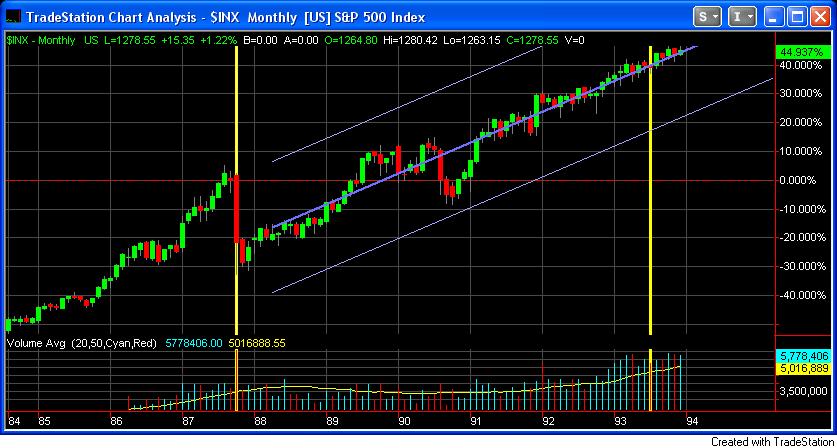
That said, if the ME does have an effect on financial markets, it exhibits a pattern repeated for each of the three prior largest Maharishi Effect projects, DC (1993), Heaven on Earth (1987) and Utopia (1983-4) are reviewed below. More detailed analysis and graphics are in Charts 8-13.
Three patterns or phases (P1,P2,P3 ) emerge upon examining short-run ME effects on financial markets:
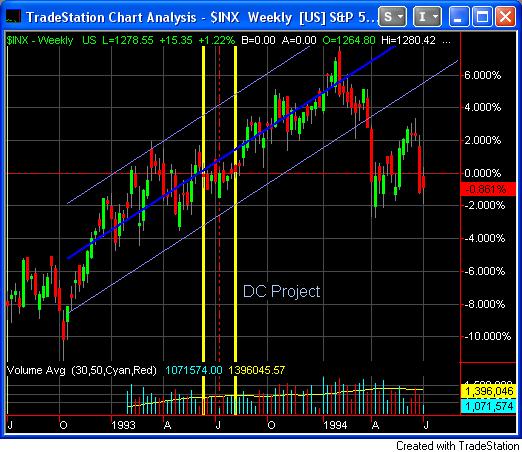
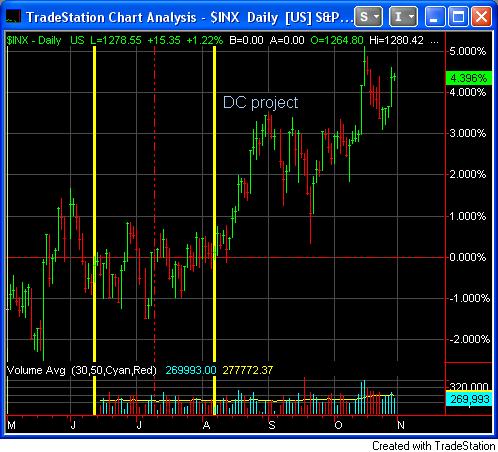
The market remained in a trading range during the DC project, interupting the prior year's sharply rising market trend. Thus the DC project exhibits P1 -- it changed from a strong two year upward trend -- and stopped in its tracks during the project. The DC project also exibits P2 --for 14 months after the project the market remained within a trading range -- though a volitle one. Three times it rallied and declined, trying to break through the lower and upper boundaries of its range. After 14 months, it finally broke through its upper bound and transformed into into an upward trend, consistent with P3.
Heaven on Earth
For at least a year prior to the Heaven on Earth project to demonstrate the Maharish Effect (4000 YFs), the S&P 500 experienced a strong upward trend. Precisely during theHoE, project, the S&P 500 experienced "Black Monday" -- its largest decline, over 30%, in many decades, a strong demonstration of P1. After this significant market crash, the market remained for several months in a mild trading range, charactersitic of P2. And after several months of the project and crash, the market assumed an upward trend, characteristic of P3.
Utopia
Prior to the Utopia(8000 YFs) project, the market was in a trading range for three months, after a strong positive trend in the preceeding year. During the project, there was a 4% "pop' -- which may have been due to a "January effect" -- a hypotheses found valid by several studies by financial econometricians. However, during the later stages of the project (needs to be validated exact end of project) , during january and early februrary 1984, the market experienced a sharp decline of over 10% , characteristic of P1. Over the next five months the market was in a flat of slightly declining range, characteristic of P2. After five months, the market began a strong positive upward trend, characteristic of P3.
With only three projects thus far analyzed, its possible, probable, that the Maharishi Effect has no visible effect on financial markets, and the following are simply spurious / random correlations.
That said, if the ME does have an effect on financial markets, it exhibits a pattern repeated for each of the three prior largest Maharishi Effect projects, DC (1993), Heaven on Earth (1987) and Utopia (1983-4) are reviewed below. More detailed analysis and graphics are in Charts 8-13.
Three patterns or phases (P1,P2,P3 ) emerge upon examining short-run ME effects on financial markets:
- market trends flatten or reverse DURING the project
- 2-14 months after the project market trends are flat or remain within a trading range.
- after this flat period, trends become positive.
- major medical procedure -- the patient experiences a type of shock from the major intervention, sytems flatten or reverse.
- a recouperation phase where the patient rests and heals from a major medical procedure
- a healthy rebound, beyond past levels of vigor, after the patient is fully healed.
The market remained in a trading range during the DC project, interupting the prior year's sharply rising market trend. Thus the DC project exhibits P1 -- it changed from a strong two year upward trend -- and stopped in its tracks during the project. The DC project also exibits P2 --for 14 months after the project the market remained within a trading range -- though a volitle one. Three times it rallied and declined, trying to break through the lower and upper boundaries of its range. After 14 months, it finally broke through its upper bound and transformed into into an upward trend, consistent with P3.
Heaven on Earth
For at least a year prior to the Heaven on Earth project to demonstrate the Maharish Effect (4000 YFs), the S&P 500 experienced a strong upward trend. Precisely during theHoE, project, the S&P 500 experienced "Black Monday" -- its largest decline, over 30%, in many decades, a strong demonstration of P1. After this significant market crash, the market remained for several months in a mild trading range, charactersitic of P2. And after several months of the project and crash, the market assumed an upward trend, characteristic of P3.
Utopia
Prior to the Utopia(8000 YFs) project, the market was in a trading range for three months, after a strong positive trend in the preceeding year. During the project, there was a 4% "pop' -- which may have been due to a "January effect" -- a hypotheses found valid by several studies by financial econometricians. However, during the later stages of the project (needs to be validated exact end of project) , during january and early februrary 1984, the market experienced a sharp decline of over 10% , characteristic of P1. Over the next five months the market was in a flat of slightly declining range, characteristic of P2. After five months, the market began a strong positive upward trend, characteristic of P3.
Saturday, July 29, 2006
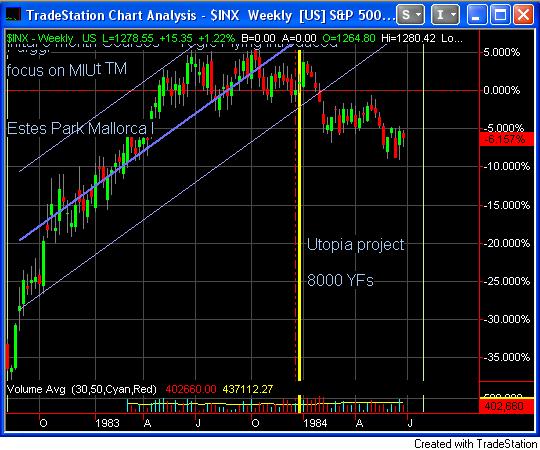
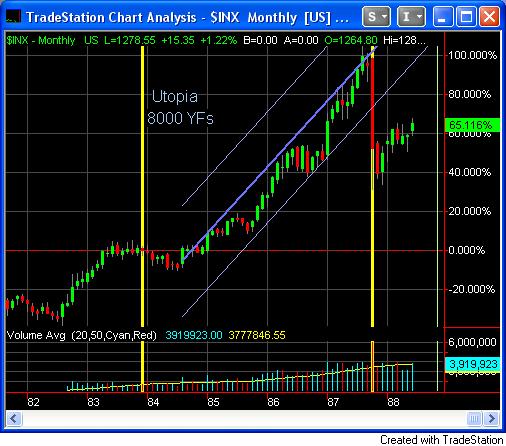
Chart #13 Utopia Project -- weekly
In the year and a half prior to Utopia project the S&P 500 was in a sharp upward trend -- gaining more than 40%, reaching a peak about 3 months prior to the project. It then experienced a 7% or so correction, from which is was recovering at the start of the Utopia project. During the project it took a 10% or so hit, then was constrained in a trading range through August 1984. During the week of August 3, it dramatically shot up 10% or so, recovering to pre-project levels.
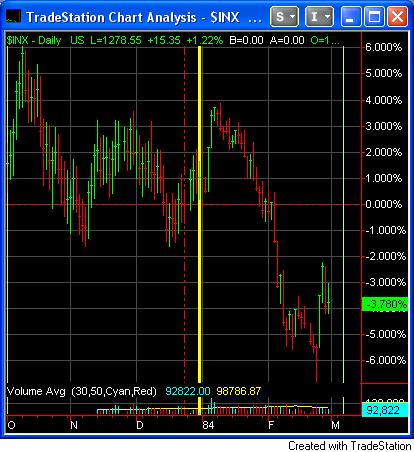
Chart #12 Utopia Project -- daily
The peak of YF numbers for the Utopia project was in the last days of 1983, reaching up to 8000 -- 4x the target figures for the Current 2006 ME project. The project continued for a number of weeks into 1984 with lower numbers of YF.
At the peak of the course, the market remained in a trading range. During the first four days of the new year, the S&P500 did experience a 4% increase. However, sharp movements in the beginning of a new year, after the Holiday lull of reduced volume and market activity -- a phenomenon validated by several financial econometric studies.
However, starting on the fifth market day of the year, still during the later phases of the Utopia project, the market began a strong decline through early February, of over 10% .
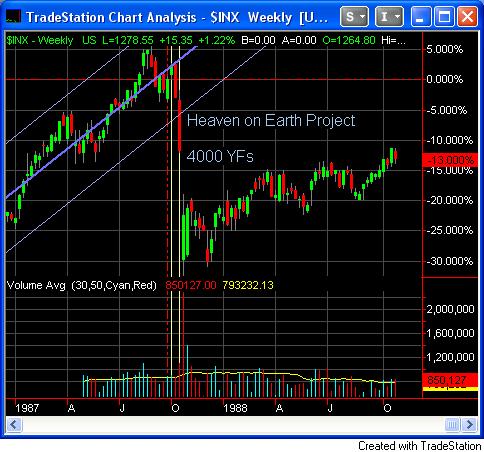
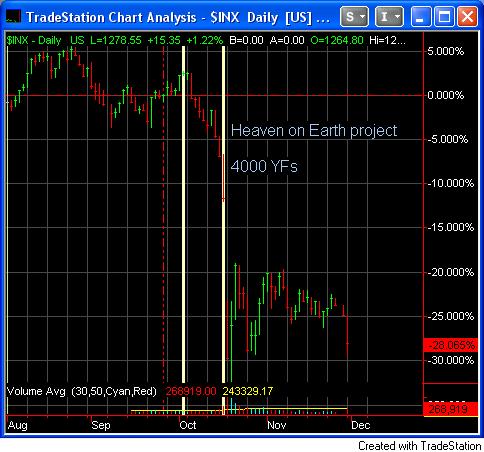
Chart #10 Heaven on Earth Project -- daily
Just days after theHoE project, the S&P 500 experienced "Black Monday", its largest decline, over 30%, in many decades -- perhaps the largest since the 1929 crash. This project had 4000 or so Yogic Flyers at its peak, twice the target number of the current 2006 summer ME project.
Friday, July 28, 2006
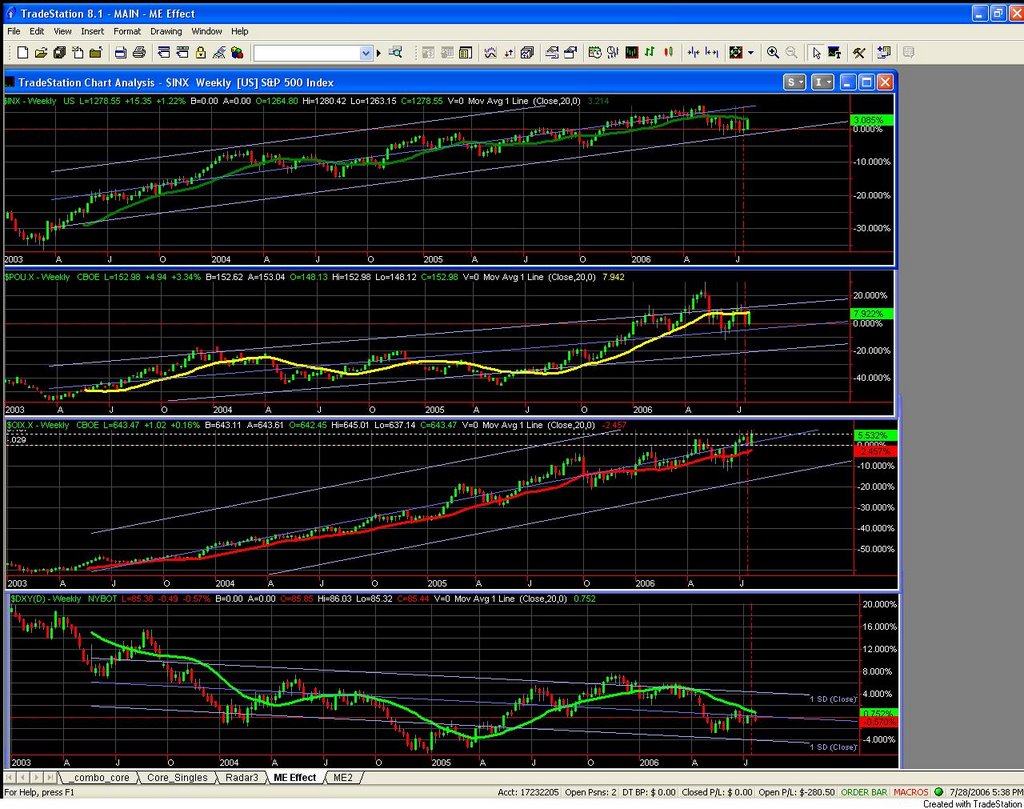
Chart#7
S&P500, Gold, Oil and Dollar
2003-2006 Moving Avg, Trendline and 1 SD Bands
July24-28, 2006 [and 3.5 Year] Change and --- Consistency with US Positive Trends:
- S&P500 +3% [+50%] --- Consistent
- Gold + 7.9% [+100% ] --- Inconsistent
- Oil + 5.5% [+100%] --- Inconsistent
- Dollar -.6% [-16%] --- Inconsistent

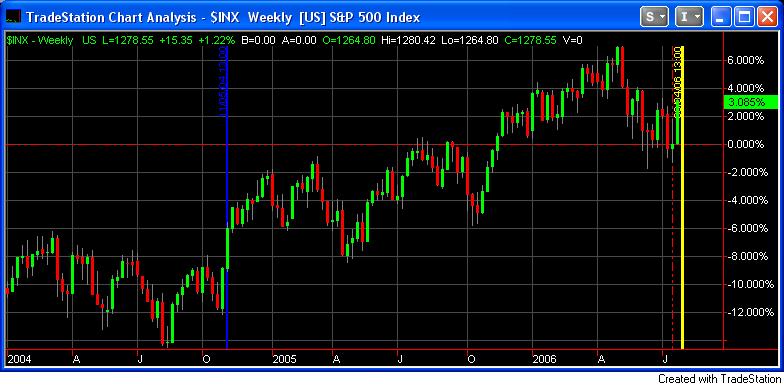
Chart #6
S&P 500 Trend 2003-2006
Regression Trendline with 1 Standard Deviation Bands
3% Rise 1st week of Course
With a 5% additional rise in the next several weeks would, the index would cross its long run (statistical) regression-based trendline, that is, its movement would be indicative of a normal correction towards equillibrium.
With a 20% additional rise of the index over the next 10 weeks or so, the index would exceed its upper 1 standard deviation bound -- the general boundary for deviations of the index from its long-run trend line. This would be indicative of a possible SIGNIFICANT effect from the course, and not simply the index following its long run trend, with normal deviations.
If the 20% + rise increase over the next 6-10 weeks did occur, breaking its normal deviation from its long run trend, and assuming the course continues that long, and if after the end of course the index declined back below its long-run statistical trendline, it would be noteworthy.
See the independent blog
http://me-peace-centers.blogspot.com/
for speculations on potential rapid expansion of ME Peace Centers and further coherence effects if the abovefinancial impacts were observed.
This blog, and the ME Peace Centers blog, are independent and not associated with the organizations involved in developing and implementing the ME technologies.
Excerpts from course Press release.
The price of gold and crude oil dropped markedly during the second day of the "Invincible America Course".
Rising stock markets and declining gold and oil prices are all strong indicators of rising optimism and confidence in the country's economic future. Experts predicted the upheaval in the Middle East would depress Wall Street and send gold and oil skyrocketing. To the surprise of most economists, the opposite occurred.
[Blogger Note: This is incorrect. oil and gold have have sharpley increased since July 24. (See chart #3)
And the Dollar has declined. (see chart #4)]
[Blogger note: after rising since the beginning of the course, the maket sharply declined starting around 9am PDT (time on chart) , noon EDT on 7/27. (See charts #1 and #2)]
Subscribe to:
Posts (Atom)