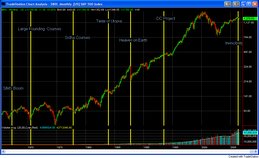
The enourmous goof, cited in the last post, by IA researchers is astonishing. How could such mistakes occur -- in the face of real data. (claiming a 3/10,000 chance for normal occurance of recent market increases since the start of IA -- when such an event -- a 13% run-up in 17 weeks -- has occurred over 220 times since 1960.
One possibility for the goof is a well-known issue that can be made in studies of financial markets is to using analysis and models that assume a normal distribution. Distributions of the returns for most financial markets, certainly the S&P 500 -- the proxy for all US markets -- has "fat tails" and a lower peak than a normal distribution. More like the top half of a somewhat flattened circle -- aka an elipse, than the classic "bell" shape of a normal (aka guassian) distribution.
For some analysis, in the main body of the distriubtion, the difference is not to substantial. However, when analyzing the tails, the extreme events, the normal distribution extremely underestimates the occurence of extreme gains or losses, that is the top or bottom 1% or more accutely, the top .1% of the distribution.
Such laxness in using normal distribution assumptiosn when modeling financial markets is one reason for the famous, dramatic collapse of the hedge fund LTC -- Long Term Capital -- built and managed by some of the best academic minds on Wall St. They simply underestimated the probability of "the perfect storm". Instead of being a one in 500 or so year event, it occurs far more "frequently" -- and did so on their watch, collapsing 100 billion dollar portfolios to nothing within weeks.
As an example of this, looking at just 13 years of S&P 500 data, assuming a normal distribution -- as is the case when applying most tests of significance in statistics, the top return day, is overestimated in its rarity, by a factor of 15,000. The third top day by a factor of 5000. The top 10th day by a factor of 250. The rarity of the top 80 days are overstated by assuming the S&P 500 is normally distributed, though the factor of overstatement declines rapidly from the top down to the 80th highest daily return. The same occurs on the left tail, the lowest, or most negative returns. And in the middle of the distribution, the "rarity" of returns is underestimated.
In the IA analyusis, the same principle applies: Assuming normal distribution, as most statistical and econometric software does, will underestimate the frequency of extreme events -- certainly the top 1 or 2, or 10 or so. In other words, it will deem such a tail event much rarer than it really is, Thus, the 3/10,000 probability couldbe overestimated by a factor of 100 or 1000.
A second possibility of where the IA analysis flaw lies is overspecification of the event. For example, instead of testing for 13% rises in the S&P 500 over 17 weeks, one could have tested 13% rises in the S&P 500 over 17 weeks where there is a pattern that there are weekly declines in the 3rd, 5th and 7th weeks of the series. That is the pattern of the recent rise, but is absolutely unimportant to the premise being tested: if the 13% rises in the S&P 500 over 17 weeks is "rare" or if it naturally occurs periodically. The occurence of 13% rises in the S&P 500 over 17 weeks with weekly declines in the 3rd, 5th and 7th weeks of the series is indeed much rarer than the over 220 times the simpler 13% rises in the S&P 500 over 17 weeks has occurred since 1960.
Perhaps the overspecified event happened only this time, First time ever. So it would about 1/2500 (52 weeks * 47 years) or so probability, which is in the range of the IA's 3/10,000, 1/3333 or .033% stated probability. But of course such a hypothetical overspecified analysis is quite flawed since the pattern of weekly declines in the 3rd, 5th and 7th weeks is totally inconsequential to the event of interest: a 13% rise in 17 weeks. The event, not overqualified or orverspecified in inessential ways, has occurred over 220 times in under 2500 weeks -- about 10%. Far from .033%.
Thus, the caveat to always eye-ball the underlying data and results. Does looking at the recent rise in the context of looking at the last 10 or best yet, 40 years of S&P 500 data seem quite unique? No, similar run-ups occured quite periodically.
Subscribe to:
Post Comments (Atom)


No comments:
Post a Comment