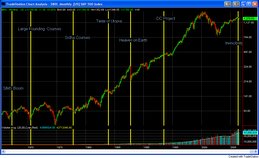
With only three projects thus far analyzed, its possible, probable, that the Maharishi Effect has no visible effect on financial markets, and the following are simply spurious / random correlations.
That said, if the ME does have an effect on financial markets, it exhibits a pattern repeated for each of the three prior largest Maharishi Effect projects, DC (1993), Heaven on Earth (1987) and Utopia (1983-4) are reviewed below. More detailed analysis and graphics are in Charts 8-13.
Three patterns or phases (P1,P2,P3 ) emerge upon examining short-run ME effects on financial markets:
- market trends flatten or reverse DURING the project
- 2-14 months after the project market trends are flat or remain within a trading range.
- after this flat period, trends become positive.
- major medical procedure -- the patient experiences a type of shock from the major intervention, sytems flatten or reverse.
- a recouperation phase where the patient rests and heals from a major medical procedure
- a healthy rebound, beyond past levels of vigor, after the patient is fully healed.
The market remained in a trading range during the DC project, interupting the prior year's sharply rising market trend. Thus the DC project exhibits P1 -- it changed from a strong two year upward trend -- and stopped in its tracks during the project. The DC project also exibits P2 --for 14 months after the project the market remained within a trading range -- though a volitle one. Three times it rallied and declined, trying to break through the lower and upper boundaries of its range. After 14 months, it finally broke through its upper bound and transformed into into an upward trend, consistent with P3.
Heaven on Earth
For at least a year prior to the Heaven on Earth project to demonstrate the Maharish Effect (4000 YFs), the S&P 500 experienced a strong upward trend. Precisely during theHoE, project, the S&P 500 experienced "Black Monday" -- its largest decline, over 30%, in many decades, a strong demonstration of P1. After this significant market crash, the market remained for several months in a mild trading range, charactersitic of P2. And after several months of the project and crash, the market assumed an upward trend, characteristic of P3.
Utopia
Prior to the Utopia(8000 YFs) project, the market was in a trading range for three months, after a strong positive trend in the preceeding year. During the project, there was a 4% "pop' -- which may have been due to a "January effect" -- a hypotheses found valid by several studies by financial econometricians. However, during the later stages of the project (needs to be validated exact end of project) , during january and early februrary 1984, the market experienced a sharp decline of over 10% , characteristic of P1. Over the next five months the market was in a flat of slightly declining range, characteristic of P2. After five months, the market began a strong positive upward trend, characteristic of P3.


No comments:
Post a Comment