
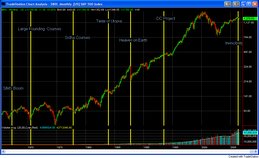
Chart #6
S&P 500 Trend 2003-2006
Regression Trendline with 1 Standard Deviation Bands
3% Rise 1st week of Course
With a 5% additional rise in the next several weeks would, the index would cross its long run (statistical) regression-based trendline, that is, its movement would be indicative of a normal correction towards equillibrium.
With a 20% additional rise of the index over the next 10 weeks or so, the index would exceed its upper 1 standard deviation bound -- the general boundary for deviations of the index from its long-run trend line. This would be indicative of a possible SIGNIFICANT effect from the course, and not simply the index following its long run trend, with normal deviations.
If the 20% + rise increase over the next 6-10 weeks did occur, breaking its normal deviation from its long run trend, and assuming the course continues that long, and if after the end of course the index declined back below its long-run statistical trendline, it would be noteworthy.
See the independent blog
http://me-peace-centers.blogspot.com/
for speculations on potential rapid expansion of ME Peace Centers and further coherence effects if the abovefinancial impacts were observed.
This blog, and the ME Peace Centers blog, are independent and not associated with the organizations involved in developing and implementing the ME technologies.


No comments:
Post a Comment