skip to main |
skip to sidebar
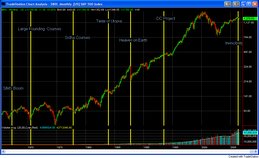
Chart #1 Stock Indices 50 day
- Top graph are four major US stock indices: Dow Jones Industrials (turquoise), S&P 500 (green), Nasdaq Composite (yellow), and Russel 2000 (copper).
- The second graph are stock indices that are speculated as being "negative" in terms of ME social coherence theory. Gambling (copper), Tobacco (turqoise), Defense (yellow), and Pharmecuticals (green), Soft Drinks (brown).
- The third graph are stock indices that are speculated as being "positive" in terms of ME social coherence theory. Technology (blue), Internet Services (turquoise), Wireless Communications (green), and Telecomunications (copper).
- The dotted straight lines are trendlines.


No comments:
Post a Comment